Day 4 - Category: Hexagons
#30DayMapChallenge - November 4th
QGIS PROBLEM & NO HEXAGONS
After my QGIS failed earlier this week, I’ve had to change directions somewhat for my 30DayMapChallenge path. Always up for extra difficulty, my portable dev computer is a
Toshiba Chromebook running an ubuntu linux derivative. I have been pleasantly surprised at what this tiny, low-powered device is capable of, e.g. linux, VScode, node, django, QGIS…
Chromebook Programming
The best ubuntu 18.04 version of QGIS that I have had success with was 3.4. After using the
Socrata plugin for QGIS, which would be a huge benefit for accessing my potential data sources for the Challenge, I had some difficulties with setting the CRS. The layers brought into the map were not being shown properly. Seeing that others had mentioned this same issue, I thought it was time to upgrade and possibly get rid of some problems with this somewhat outdated version of Q. Well I’ve succeeded in deleting my existing install and have not had luck signing the gpg keys for a newer version. This is also complicated by the lack of space on the Chromebook (16 GB!).
New Geo Problems!
Today at my day job I encountered a new geospatial problem. I was asked if I had some drone photos of a certain location
(yes I am also a Part 107 UAV pilot). While I have my flights organized by year and a short description, the process of looking through thousands of photos is EXTREMELY tedious as we all know. This is compounded by the lag of accessing the photos on a network over a VPN connection.
Python GPSPhoto Library
My hope was to use python to obtain the gps coordinates from each drone photo, append each record into a dataframe, and off we go. There is a python library,
GPSPhoto, that allows you to do just this, as described here:
https://sylvaindurand.org/gps-data-from-photos-with-python/
To get this to work in a Jupyter Notebook I also needed to
pip install piexif and pillow libraries. This allowed me to create a recursive function using the os library that would search the current directory and all sub-directories for any file that
.endswith('JPG'). This worked without too much trouble and I was then able to create a blank dataframe with appropriate columns and append the name of each photos and coordinates as a new record. We’ve got ArcGIS Pro and arcpy installed, so I was able to import
ESRI python libraries, and load the dataframe into a spatially enabled dataframe (the proprietary format you love to hate).
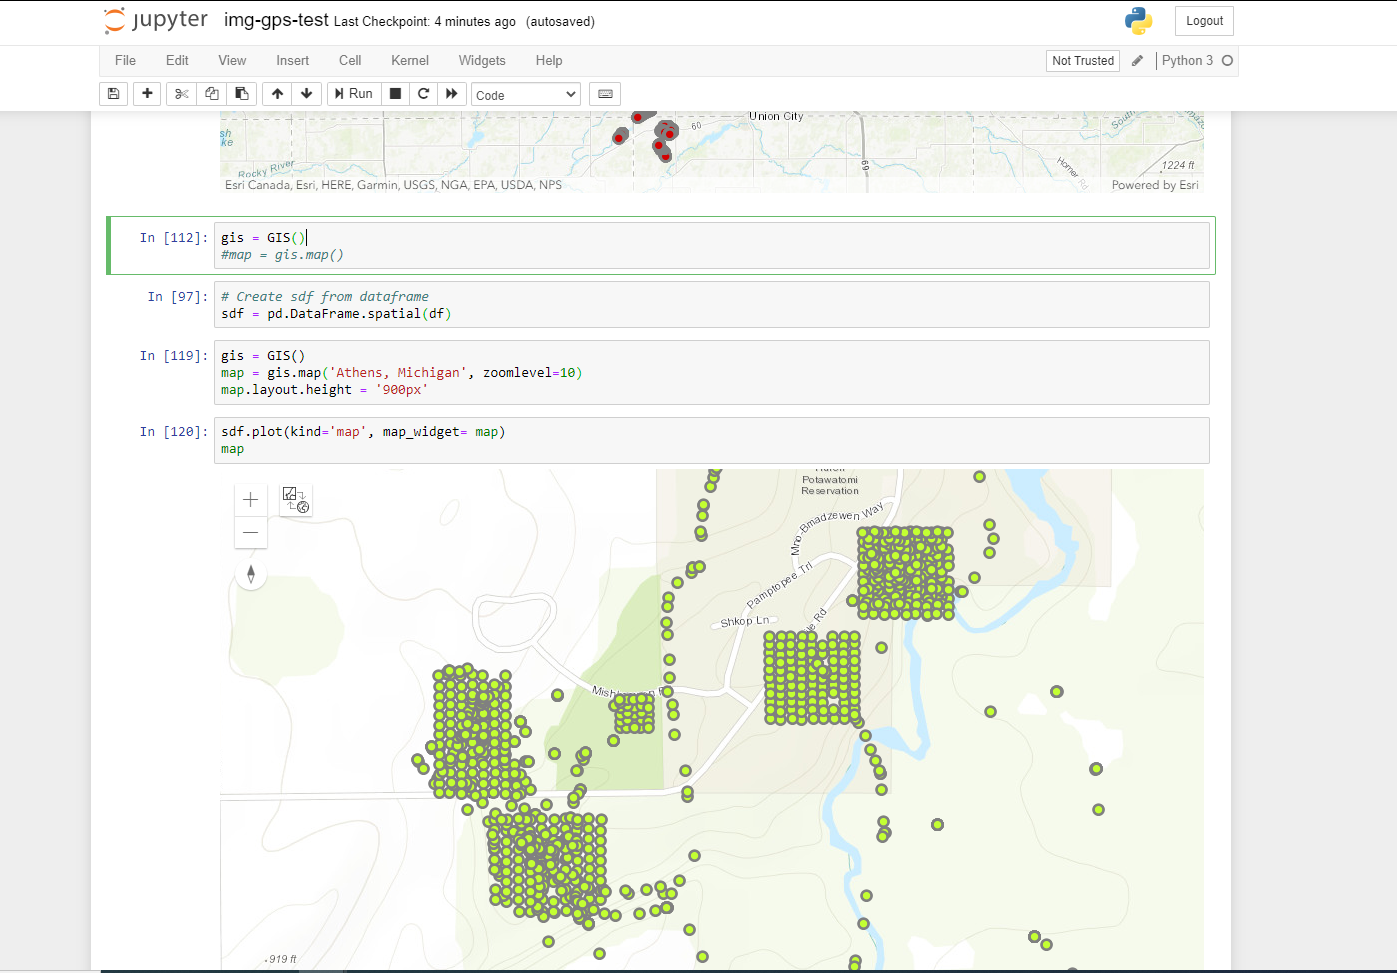
We have drone photo locations on the map!
sdf.plot() and we are off! We can view all of the drone photo locations as points on an interactive map, courtesy of the ArcGIS Python API map widget. They were nice enough to include a built-in popup that shows the attributes for each photo, and I was able to locate pics near the area of interest. It took some time for the function to chug through all of the photos and create the dataframe, so I took the extra step of exporting them via: df.to_csv('X:\\UAV\\2020UAVgps.csv', index=False) - which was easy and efficient. They can then be added to Arc Pro as a table, and XY generated from the attributes, and we should also be able to re-create a GeoDataframe from the CSV. The sdf.plot() resulted in error messages for several of the CSV’s, though I didn’t have time to try to interpret these annoyingly long python errors.
One other thing, if you try to use the
ESRI Python map widget in a Google Colab Notebook, it
wouldn’t work the last time I checked. This is related to various incompatibilities between Colab and certain .ipywidgets. If you’ve gotten it to work I would be happy to hear from you!
Stay Calm and Map On